
NSE Option Chain
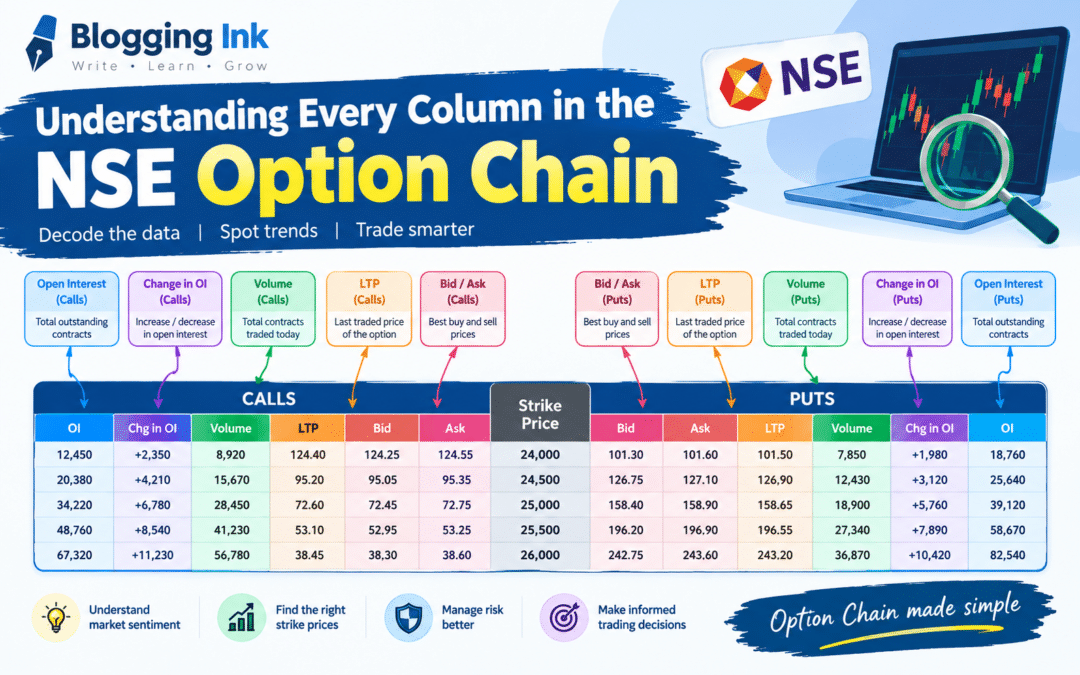
In Part 1 we found out what an LTP Calculator is, how the NSE Option Chain works and why using both tools helps traders make choices. Now it’s time to look closely at every column in the option chain. Knowing what each column means is important because experienced traders don’t look at option premiums. They look at Open Interest (OI) Change in OI, Volume, Volatility (IV) Bid/Ask prices and the Last Traded Price (LTP) all together before making a trade.
Why Knowing the Option Chain Is Important
The NSE Option Chain is one of the tools that options traders can use. It shows market data for every possible strike price. This helps traders see what the market is thinking how much money is moving around and where possible support and resistance levels might be.
When you use an LTP Calculator with the option chain the option chain becomes more than a list of numbers. It becomes a tool for making choices. Of just looking at option prices traders can compare different contracts find good strike prices and understand why an option’s price is going up or down.
Experienced traders never base their decisions on one number. They look at numbers at the same time to get a full view of the market.
Structure of the NSE Option Chain
The option chain has three parts:
| Call Option (CE) | Strike Price | Put Option (PE) |
| OI | 24900 | OI |
| Change in OI | 25000 | Change in OI |
| Volume | 25100 | Volume |
| IV | 25200 | IV |
| OI | 25000 | OI |
| LTP | 25300 | LTP |
| Bid Qty | Bid Qty | |
| Bid Price | Bid Price | |
| Ask Price | Ask Price | |
| Ask Qty | Ask Qty |
The strike price is in the middle. Call option data is on the left. Put option data is on the right. Each row shows an option contract for the same expiry date.
Understanding the Call Side and the Put Side
Before looking at each column it’s important to know the two parts of the option chain.
Call Option (CE)
A Call Option gives the buyer the right, but not the duty to buy the asset at a price before it expires. Call buyers hope the market will go up.
Example
Nifty is at 25,000
Trader buys:
- 25,000 CE
- Premium = ₹150
If Nifty goes up to 25,300 the call price might go up a lot giving the buyer a chance to make money.
Put Option (PE)
A Put Option gives the buyer the right, but not the duty to sell the asset at a price before it expires.
Put buyers hope the market will go down.
Example
Nifty is at 25,000
Trader buys:
- 25,000 PE
- Premium = ₹145
If Nifty drops to 24,700 the put price may go up helping the buyer make a profit.
Looking at Both Sides Together
Experienced traders don’t look at one side. They compare how call and put options behave at the strike prices.
For example:
| Strike | Call LTP | Put LTP |
| 24,900 | ₹210 | ₹60 |
| 25000 | ₹150 | ₹110 |
| 25100 | ₹100 | ₹175 |
If call prices go up and put prices go down it may show that people are expecting the market to rise. If put prices go up and call prices go down it may show that people are expecting the market to fall.
Understanding the Strike Price
The Strike Price is the price at which the underlying asset can be bought or sold if the option is used.
It is the starting point for every option contract.
Example
Nifty is at 25,050
Available strike prices:
- 24,800
- 24,900
- 25,000
- 25,100
- 25,200
- 25,300
Each strike has its price, Open Interest, Implied Volatility and how much is being traded.
Types of Strike Prices
In-the-Money (ITM):- These options already have some value.
Example
Nifty is at 25,000
Call:
24,800 CE
Intrinsic Value = ₹200
At-the-Money (ATM):- The strike price is very close to the market price.
Example
Nifty = 25,000
ATM Strike = 25,000
ATM options are usually the active and easy to trade.
Out-of-the-Money (OTM):- These options do not have any value now but could gain value if the market moves in the right direction before expiry.
Example
Nifty is at 25,000
Call:
25,300 CE
This option is made up entirely of time value.
Open Interest (OI)
Open Interest (OI) is the number of open option contracts that have not been closed or expired. It is different from trading volume, which counts how many trades happened. OI shows how many positions are still active.
Why OI Matters
High Open Interest can mean:
- Many people are involved
- More money is moving around
- Important levels for support or resistance
- More people are confident in the market
An LTP Calculator NSE Option Chain often points out OI strike prices because they can have a big effect on the market.
Example
| Strike | Call OI |
| 24,900 | 4,50,000 |
| 25000 | 9,80,000 |
| 25100 | 13,50,000 |
The highest Call OI at 25,100 may show that this is a resistance level as many traders have positions here.
Change in Open Interest (Change in OI)
This column shows how many new contracts were added or removed during the day. It helps traders see if new positions are being created or old ones are being closed.
Positive Change in OI
If OI goes up it means new positions are being made.
Example
Morning OI = 5,00,000
Current OI = 6,20,000
Change in OI = +1,20,000
This means more people are joining the market.
Negative Change in OI
If OI goes down it means traders are closing positions.
Example
Morning OI = 8,00,000
Current OI = 6,70,000
Change in OI = –1,30,000
This may mean people are taking profits or ending their trades.
Price and OI Relationship
Experienced traders often look at price. Oi together:
| Price | OI | Interpretation |
| Price ↑ | OI ↑ | Long Build-up (Long positions are increasing) |
| Price ↓ | OI ↑ | Short Build-up (Short positions are increasing) |
| Price↑ | OI ↓ | Short Covering (Short positions are being closed) |
| Price ↓ | OI ↓ | Long Unwinding (Long positions are being closed) |
This helps traders see if market moves are from new money or from people closing their bets.
Trading Volume
Volume shows how many contracts were traded during the session.
It is different, from OI, which shows how many positions are still open. Volume shows how much is being traded.
Why Volume Is Important ?
High volume suggests:
- liquidity
- Easier order execution
- Lower slippage
- Greater trader participation
Example:
| Strike | Volume | |
| 25,000 CE | 1,25,000 | |
| 25,100 CE | 45,000 | |
| 25,200 CE | 10,500 |
The 25,000 CE has higher trading activity making it a more liquid contract.
OI vs Volume
Many beginners confuse these metrics.
| Open Interest | Volume | |
| Open contracts | Executed trades | |
| Indicates outstanding positions | Indicates trading activity | |
| Builds over time | Resets daily | |
| Useful for identifying support/resistance | Useful for assessing liquidity |
Both should be analyzed together for a clearer market view.
Implied Volatility (IV)
Implied Volatility (IV) measures the markets expectation of price movement. It reflects anticipated volatility than direction.
Higher IV generally results in option premiums because traders expect larger price swings.
High IV
When IV is elevated:
- Premiums increase.
- Options become more expensive.
- Uncertainty is higher.
This often occurs before events such as earnings announcements or central bank decisions.
Low IV
When IV’s low:
- Premiums decrease.
- Options become relatively cheaper.
- The market expects price movements.
Example
Nifty = 25,000
25,000 CE Premium:
- IV = 12% → Premium = ₹125
- IV = 22% → Premium = ₹180
Even if the underlying index remains unchanged a rise in IV can increase the option premium.
An advanced LTP Calculator can help traders compare premiums across IV environments.
Bid. Ask Price
Every option contract has two quoted prices:
- Bid Price: price a buyer is willing to pay.
- Ask Price: Lowest price a seller’s willing to accept.
The difference between them is known as the bid-ask spread.
Example
25,000 CE
Bid = ₹152
Ask = ₹154
Spread = ₹2
A narrow spread generally indicates liquidity while a wide spread may increase trading costs.
Why the Spread Matters
spreads can lead to:
- Better execution prices.
- Lower transaction costs.
- Reduced slippage.
Professional traders often prefer contracts with volume and tight bid-ask spreads.
Last Traded Price (LTP) Explained with Examples
The Last Traded Price (LTP) is the recent price at which an option contract was executed.
Example:
Morning:
25,000 CE = ₹150
A buyer purchases the option at ₹150.
LTP becomes ₹150.
Later:
Another trade occurs at ₹156.
The LTP updates to ₹156.
If the next trade executes at ₹154 the LTP changes again to ₹154.
This continuous updating reflects the executed transaction in the market.
LTP vs Bid vs Ask
Understanding the distinction between these values is crucial.
| Metric | Meaning | |
| Bid | Highest buying offer | |
| Ask | Lowest selling offer | |
| LTP | Most recent executed trade |
A contract with:
- Bid = ₹148
- Ask = ₹150
- LTP = ₹149
shows that the last trade occurred between the best buyer and seller prices.
Practical Example: Reading the Option Chain
Suppose Nifty is trading at 25,000.
| Strike | Call OI | Call LTP | Put LTP | Put OI |
| 24,900 | 5,20,000 | ₹210 | ₹60 | 1,10,000 |
| 25,000 | 8,80,000 | ₹155 | ₹135 | 7,90,000 |
| 25,100 | 12,40,000 | ₹110 | ₹180 | 5,40,000 |
Interpretation
- Highest Call OI at 25,100 may indicate resistance.
- Strong Put OI at 25,000 may suggest support.
- Higher Call LTP at strikes reflects greater intrinsic value.
- Comparing these values with an LTP Calculator option chain helps traders identify contracts evaluate liquidity and assess potential entry points.
Common Mistakes When Reading the Option Chain
Many new traders misinterpret option chain data. Common errors include:
- Choosing options solely because the premium is low.
- Ignoring Open Interest.
- Overlooking implied volatility.
- Misunderstanding bid-ask spreads.
- Assuming a LTP guarantees a profitable trade.
- Ignoring liquidity and trading volume.
- Failing to compare strike prices and expiries.
Avoiding these mistakes can improve trade quality. Reduce unnecessary risk.
Key Takeaways
- The NSE Option Chain provides a view of available option contracts and their market activity.
- Strike Price determines the exercise level for an option. Is the reference point for all option chain analysis.
- Open Interest (OI) indicates positions and can highlight potential support and resistance levels.
- Change in OI reveals whether traders are building positions or unwinding existing ones.
- Volume measures trading activity. Helps identify liquid contracts with better execution.
- Implied Volatility (IV) influences option premiums. Reflects expected market movement.
- Bid and Ask prices reveal the available buying and selling quotes while the Last Traded Price (LTP) shows the most recent executed transaction.
- An LTP Calculator becomes significantly more powerful when used alongside these option chain metrics helping traders interpret premiums of relying on price alone.
In Part 3, we’ll explore the mechanics behind the NSE Option Chain LTP Calculator, including how option prices are calculated, the mathematical logic of premium movement, live market data integration, price discovery, intrinsic value, time value, and a beginner-friendly introduction to Option Greeks (Delta, Gamma, Theta, Vega, and Rho). This section will provide the technical foundation needed to understand why option premiums change in real market conditions.
Recent Comments